

TL;DR:
- Blood panel interpretation transforms raw lab values into meaningful health insights by considering clinical, pattern, and trend contexts. Understanding the limitations of reference ranges and recognizing the importance of pattern recognition helps identify subclinical issues and optimize health. Regular, contextualized testing coupled with proactive lifestyle adjustments enhances long-term well-being and disease prevention.
Blood panel interpretation is the process of translating raw lab values into meaningful health signals that reveal what your body is actually doing at a biological level. Raw numbers from a Complete Blood Count (CBC) or Comprehensive Metabolic Panel (CMP) mean nothing without context. Understanding blood test results is what separates passive testing from proactive health management. If you want to identify deficiencies, track metabolic function, or make informed lifestyle changes, knowing why interpret blood panels matters is the first skill you need.
Why interpreting blood panels matters beyond the numbers
Most people receive their results, scan for red flags, and move on. That approach misses the point entirely.
Reference ranges cover 95% of healthy individuals statistically. That means 1 in 20 healthy people will show an out-of-range value with no underlying disease. A single flagged result is not a diagnosis. It is a data point that requires context.
Blood test results misinterpreted 10–20% of the time when clinical context is absent. That figure reflects what happens when symptoms, medical history, and prior results are ignored in favor of reading values in isolation. The number alone cannot tell you whether a slightly elevated creatinine reflects kidney stress or simply that you trained hard yesterday and skipped breakfast.
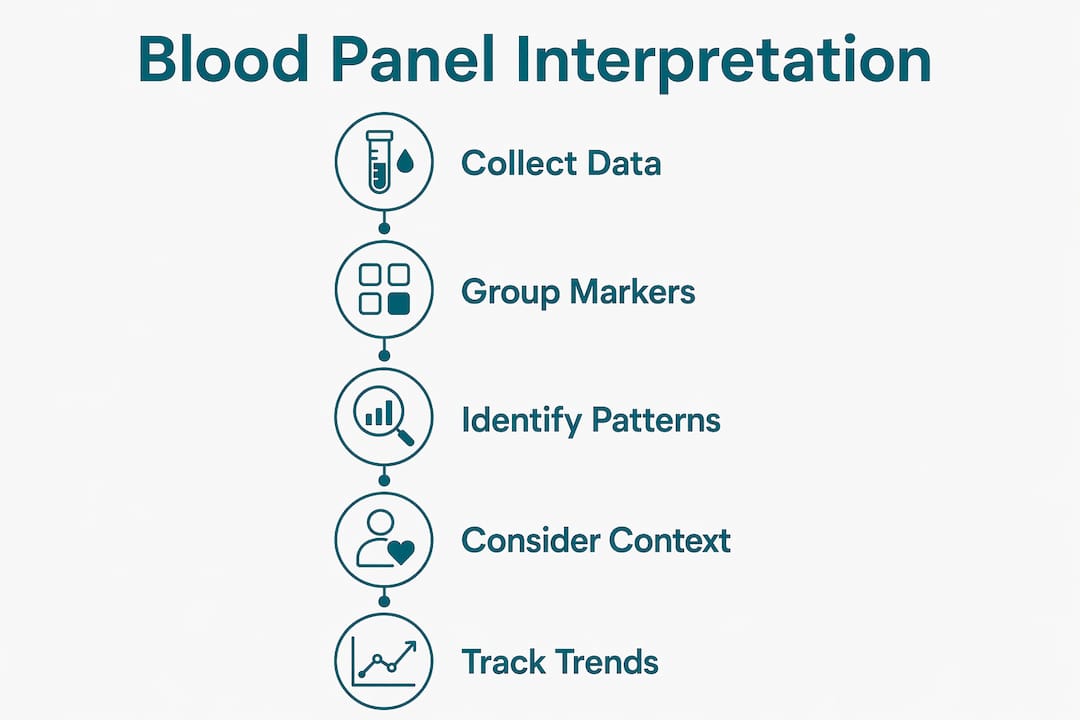
Interpreting lab results effectively requires three layers of context:
- Clinical context: Your symptoms, medications, and medical history all shift what a value means.
- Pattern recognition: Multiple markers trending in the same direction carry far more weight than one isolated flag.
- Temporal trends: A single result is a snapshot. A series of results over 6–12 months is a story.
Pro Tip: Before reviewing your results, write down your hydration status, recent exercise, fasting duration, and any supplements taken in the 48 hours prior. These pre-analytical variables directly affect your numbers and are the first thing a skilled interpreter checks.
Integrated interpretation across systems improves diagnostic accuracy more than reviewing individual markers. Viewing hematological, biochemical, and inflammatory markers together reveals patterns that isolated readings hide entirely.
How to read blood panels: key components and what they reveal
Routine panels like the CBC and CMP analyze roughly 40 measurements covering hematological, metabolic, liver, kidney, and electrolyte function. That breadth makes them one of the most cost-effective health audits available. The challenge is knowing how to group and read those measurements intelligently.

Core marker groups to understand
| System | Key Markers | What They Signal |
|---|---|---|
| Hematological | Hemoglobin, hematocrit, MCV, WBC, platelets | Oxygen transport, immune activity, clotting capacity |
| Metabolic / Glucose | Fasting glucose, HbA1c, insulin | Blood sugar regulation and insulin sensitivity |
| Liver | ALT, AST, GGT, bilirubin | Liver stress, detoxification load, alcohol or drug impact |
| Kidney | Creatinine, BUN, eGFR | Filtration efficiency and hydration status |
| Lipids | LDL, HDL, triglycerides, total cholesterol | Cardiovascular risk and metabolic health |
| Inflammation | CRP, homocysteine, fibrinogen | Systemic inflammation and chronic disease risk |
| Micronutrients | Vitamin D, B12, ferritin, magnesium | Deficiency states affecting energy, immunity, and cognition |
| Thyroid | TSH, free T3, free T4 | Metabolic rate, mood, and energy regulation |
Reading these groups as systems rather than individual numbers is the foundation of analyzing blood markers for optimal health. For example, a slightly elevated ALT in isolation may be benign. ALT elevated alongside AST, GGT, and elevated triglycerides tells a different story about liver and metabolic stress.
Units and lab variability also matter. Vitamin D reported in ng/mL versus nmol/L produces values that look completely different but measure the same thing. Always confirm units before comparing results across labs or over time.
Pro Tip: Group your markers by system before reading them. Highlight all liver markers together, all metabolic markers together, and all inflammatory markers together. Patterns become visible immediately that you would miss reading line by line.
Patterns across multiple markers provide more meaningful insight than any single out-of-range result. Multiple elevated liver enzymes suggest clinical relevance. One slightly elevated ALT after a hard workout almost certainly does not.
What does “normal” actually mean on a blood test?
“Normal” on a lab report means your result falls within the range seen in 95% of the reference population. It does not mean optimal. It does not mean disease-free. This distinction is one of the most important in all of blood work interpretation.
Reference ranges are guideposts, not verdicts. Early or subclinical conditions, including early thyroid dysfunction, pre-diabetes, and iron depletion, frequently produce results that sit squarely within normal ranges. By the time a marker crosses the reference boundary, the underlying process may have been developing for years.
The reverse is equally true. Abnormal flags are not automatic cause for alarm. Pre-test probability heavily influences accuracy, and abnormal results in low-risk individuals are more likely to represent false positives than true disease. A 25-year-old athlete with a slightly elevated CRP after a hard training week does not have the same clinical picture as a sedentary 55-year-old with the same value.
Common factors that produce misleading results include:
- Dehydration: Concentrates markers like creatinine, sodium, and hemoglobin, making them appear elevated.
- Recent intense exercise: Transiently raises CK, AST, LDH, and even white blood cell count.
- Fasting duration: Glucose and triglycerides shift significantly based on when you last ate.
- Menstrual cycle phase: Iron, ferritin, and hemoglobin fluctuate across the cycle in women.
- Supplement timing: High-dose biotin suppresses TSH and thyroid hormone readings on certain assay types.
These pre-analytical variables profoundly influence lab markers and must be accounted for before drawing any conclusions. Optimal health assessment often requires comparing results to narrower functional ranges rather than broad population-derived reference intervals. Biostarks uses this functional range approach to give you a more precise picture of where you actually stand.
How to use blood panel results to optimize your health
Understanding what blood tests mean is only useful if you act on the information. Here is a structured approach to turning interpreted results into real health changes.
-
Identify deficiencies first. Low vitamin D, suboptimal ferritin, and borderline B12 are among the most common findings in health-conscious adults. These are also among the most correctable. Addressing them through diet, supplementation, or sun exposure produces measurable improvements in energy, immunity, and cognitive function. Biostarks’ guide on improving vitamin levels provides a practical framework for this step.
-
Map your metabolic baseline. Fasting glucose, HbA1c, triglycerides, and HDL together define your metabolic health status. Metabolic markers like these reveal insulin sensitivity and cardiovascular risk years before clinical symptoms appear. Knowing your baseline lets you measure the actual impact of dietary changes, exercise programs, or sleep improvements.
-
Track trends, not snapshots. One test tells you where you are today. Testing every 3–6 months tells you whether your interventions are working. A rising ferritin trend after adding red meat and reducing coffee near meals confirms your approach is correct. A stagnant vitamin D despite supplementation signals a dosing or absorption problem.
-
Know when to escalate. Certain patterns require a physician’s input immediately. Significantly elevated liver enzymes, a falling hemoglobin trend, or a TSH outside the 0.5–4.5 mIU/L range warrant clinical follow-up, not self-management.
-
Use biomarker profiling for depth. Standard panels miss amino acids, advanced lipid fractions, sex hormones, and organic acids. Blood biomarker profiling extends the picture beyond routine tests and is particularly valuable for athletes, people with persistent fatigue, or anyone pursuing longevity-focused health optimization.
Pro Tip: Build a personal health spreadsheet. Log each result with the date, lab, and units. After three testing cycles, trends become visible that no single report can show you.
Key takeaways
Interpreting blood panels correctly requires clinical context, pattern recognition, and trend tracking, not just scanning for out-of-range flags.
| Point | Details |
|---|---|
| Reference ranges are statistical, not optimal | 5% of healthy people fall outside normal ranges; “normal” does not mean disease-free or optimized. |
| Patterns outweigh single flags | Multiple markers trending together carry far more diagnostic weight than one isolated abnormal value. |
| Pre-analytical variables distort results | Hydration, exercise, fasting, and supplement timing all shift blood markers before the sample is even drawn. |
| Functional ranges reveal more | Comparing results to narrower optimal ranges catches subclinical issues that standard reference intervals miss. |
| Trends require repeat testing | A single result is a snapshot; meaningful health insights come from tracking the same markers over 6–12 months. |
Blood panels tell a story. read the whole thing.
I have reviewed hundreds of blood reports from people who were convinced something was seriously wrong because one marker was flagged. I have also seen people reassured by “all normal” results while carrying clear signs of suboptimal metabolic health hiding in plain sight.
The most common mistake is treating a blood panel like a pass-fail exam. It is not. It is a biological narrative. A slightly low ferritin alongside normal hemoglobin and a history of fatigue tells you something important. A borderline TSH in someone who has gained weight, feels cold, and has elevated cholesterol tells you something urgent. Neither of those stories is visible if you only look at whether values crossed a reference line.
What I advocate for is what I would call integrated reading. You look at the liver markers together. You look at the metabolic cluster together. You look at inflammation markers alongside lipids. Then you compare this month’s picture to last quarter’s. That is where the real signal lives.
The other thing I push back on is the idea that this process requires a medical degree. It does not. It requires curiosity, consistency, and a willingness to learn what your own body is telling you. Healthcare professionals are essential partners in this process, especially for complex or concerning findings. But you showing up to that conversation with a clear picture of your trends and patterns makes that collaboration dramatically more productive.
Data-driven health is not about replacing clinical judgment. It is about arriving at clinical conversations better informed and better prepared to act on what you learn.
— Romain
Take your blood panel interpretation further with Biostarks
Understanding your results is the first step. Getting results worth understanding is the second.
Biostarks, an AMR Labs SA company, uses advanced Swiss mass spectrometry to analyze vitamins, hormones, amino acids, lipids, minerals, and metabolic markers from a simple at-home sample. The reports go beyond standard reference ranges and present your data in functional context, so you can see not just what is flagged but what is suboptimal. Every result comes with clear explanations and guidance designed for people who want to act on their biology. If you are ready to move from guessing to knowing, explore Biostarks’ testing and start building a real picture of your health.
FAQ
What does it mean to interpret blood panels?
Interpreting blood panels means analyzing lab values in the context of your symptoms, medical history, and prior results to extract meaningful health insights. Raw numbers only become useful when read as patterns across systems rather than isolated data points.
Why do “normal” results sometimes miss health problems?
Reference ranges cover 95% of the healthy population statistically, which means early or subclinical conditions can produce values that appear normal while an underlying process is already developing. Functional ranges and trend tracking catch what standard reference intervals miss.
How often should i get blood panels done?
Testing every 3–6 months is the standard recommendation for people actively tracking their health. This frequency generates enough data points to identify trends and measure the impact of lifestyle changes on key markers.
Can exercise or dehydration affect my blood test results?
Yes. Pre-analytical variables including hydration status, recent intense exercise, fasting duration, and supplement timing all shift blood marker levels and can produce misleading readings if not accounted for before interpretation.
What is the difference between a blood panel and biomarker profiling?
A standard blood panel covers roughly 40 routine measurements across metabolic, hematological, and organ function markers. Biomarker profiling extends this to include amino acids, advanced lipid fractions, hormones, and micronutrients that routine panels do not measure, providing a more complete picture for health optimization.
This content is for educational purposes only and does not constitute medical advice. Always consult with a healthcare professional before making changes to your health regimen.


