

Most people think staying within standard lab ranges means they’re healthy. But here’s the truth: those ranges are designed to catch disease, not optimize performance. Health reports analyze blood biomarkers to provide personalized insights beyond standard reference ranges, using optimal zones tailored to age, gender, and goals for longevity and performance optimization. If you’re serious about peak energy, recovery, and metabolic function, you need to aim higher than just avoiding illness. This guide reveals what health reports track, how they transform raw data into action plans, and why targeting optimal zones can reshape your performance and longevity.
Table of Contents
- What are health reports and how do they work?
- Key biomarkers tracked and why they matter
- Optimal versus reference ranges: What’s the difference?
- How health reports turn data into action plans
- Limitations and caution: Getting context right
- How to get started with health reports for your goals
- Start your journey: Unlock personalized insights today
- Frequently asked questions
Key Takeaways
| Point | Details |
|---|---|
| Health reports go beyond basic labs | They reveal the unique optimal targets for your biomarker levels, not just standard disease screening ranges. |
| Personalized action plans drive results | Modern health reports combine biomarker, lifestyle, and tech data into actionable nutrition, supplement, and recovery steps. |
| Trends matter more than one-off results | Tracking and improving biomarker trends over months fosters real, lasting performance gains and longevity. |
| Expert validation is essential | While AI helps personalize recommendations, human oversight ensures safe, effective application of insights. |
What are health reports and how do they work?
Health reports are comprehensive summaries of your blood biomarker data, designed to deliver personalized, goal-driven insights rather than generic lab results. Unlike routine lab reports that simply flag values outside disease ranges, health reports turn biomarker data into prioritized, science-backed action plans. They factor in your age, gender, lifestyle habits, and performance goals to create a roadmap tailored specifically to you.
The testing process is straightforward. You collect a blood sample at home or through a partner lab, and advanced analytics contextualize your results against optimal benchmarks. The report then translates those numbers into actionable steps: nutrition tweaks, supplement protocols, exercise adjustments, and lifestyle changes ranked by potential impact.
Here’s what sets modern personal health reports apart:
- Personalized targets based on your unique profile, not population averages
- Prioritized recommendations that focus on the changes with the biggest payoff
- Trend tracking over time to reveal patterns and validate progress
- Integration with wearables and DNA data for deeper context
“Health reports shift the conversation from ‘Am I sick?’ to ‘How can I perform better?’ by revealing the gap between where you are and where you could be.”
Understanding blood biomarkers is the foundation. These measurable indicators reflect everything from metabolic efficiency to inflammation levels, giving you a real-time snapshot of your internal health status.
Key biomarkers tracked and why they matter
Not all biomarkers carry equal weight. The most impactful ones fall into six categories: metabolic, lipid, inflammation, hormone, nutritional, and performance markers. Each group reveals specific aspects of your health and offers clear targets for optimization.

Key biomarkers tracked include metabolic markers like fasting insulin, HOMA-IR, and HbA1c; lipids such as TG/HDL ratio and ApoB; inflammation indicators like hsCRP; hormones including cortisol and testosterone; nutrition markers like Vitamin D and ferritin; and performance metrics such as HRV and VO2 max. Here’s a breakdown of what these markers reveal:
| Biomarker | What It Reveals | Optimal Target |
|---|---|---|
| HOMA-IR | Insulin sensitivity | <1.0 |
| TG/HDL ratio | Cardiovascular risk | <0.87 |
| hsCRP | Systemic inflammation | <1.0 mg/L |
| Vitamin D | Immune and bone health | 40-60 ng/mL |
| Cortisol | Stress response | 10-20 µg/dL (AM) |
| Ferritin | Iron storage | 50-150 ng/mL |
These markers directly reflect your daily habits. Poor sleep tanks cortisol patterns. High-carb diets spike insulin resistance. Chronic stress elevates inflammation. The beauty of tracking top longevity biomarkers is that they give you immediate feedback on whether your lifestyle choices are working.
Pro Tip: Focus on metabolic markers first. Improving insulin sensitivity and lipid ratios creates a foundation that amplifies gains in other areas, from hormone balance to recovery speed.
Here’s the encouraging part: 80% of users improve at least one at-risk biomarker within months of following personalized recommendations. That’s not luck. It’s the power of targeted action based on your unique data.
Why does metabolic health tracking matter so much? Because metabolic dysfunction is the root cause of most chronic diseases and performance limitations. Fix your metabolic markers, and everything else gets easier.
Different types of biomarkers serve different purposes. Some predict long-term disease risk, while others reflect immediate performance capacity. Understanding which markers to prioritize based on your goals is where health reports shine. For athletes and performance-focused individuals, advanced biomarker testing can reveal hidden bottlenecks in recovery, energy production, and adaptation.
Optimal versus reference ranges: What’s the difference?
Here’s where most people get tripped up. Standard lab reference ranges are designed to identify disease, not optimize performance. If your fasting glucose is 99 mg/dL, you’re technically “normal” because you’re below the prediabetes threshold of 100. But from a performance standpoint, you’re already showing early insulin resistance.
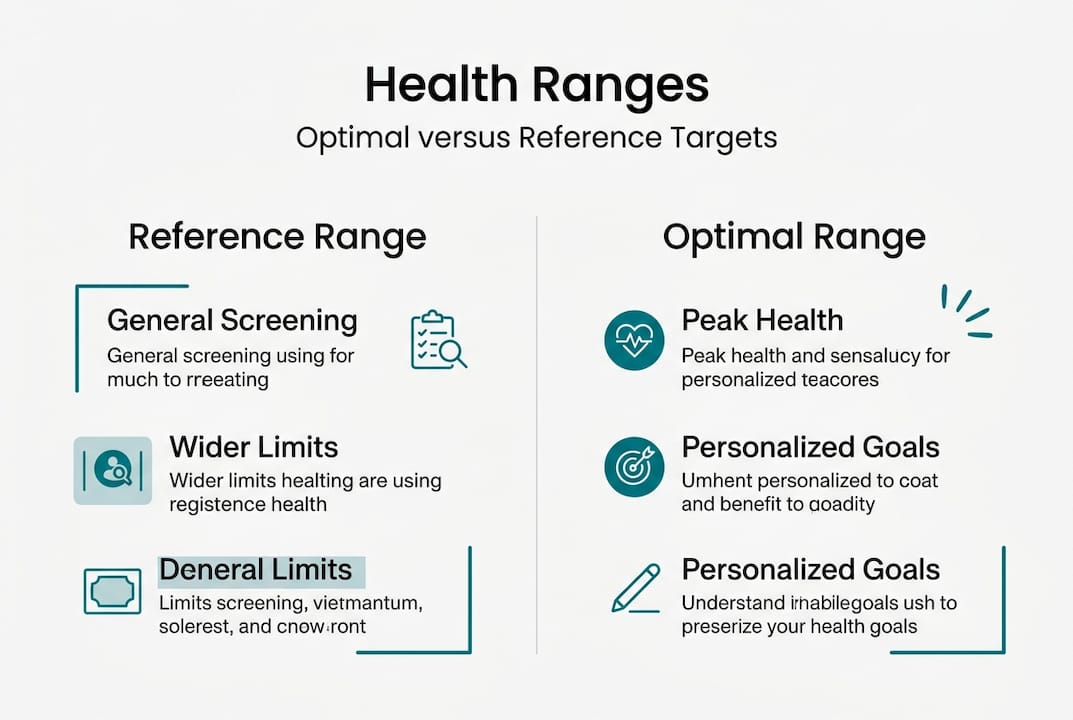
Reference versus optimal ranges differ significantly. Optimal targets like HOMA-IR below 1.0, TG/HDL ratio under 0.87, and Vitamin D between 40 and 60 ng/mL provide a proactive health advantage that standard ranges miss entirely. These tighter targets reflect what elite performers and longevity-focused individuals actually achieve.
Here’s a comparison:
| Biomarker | Reference Range | Optimal Range |
|---|---|---|
| HOMA-IR | <2.5 | <1.0 |
| TG/HDL ratio | <3.0 | <0.87 |
| Vitamin D | 20-50 ng/mL | 40-60 ng/mL |
| Fasting insulin | <25 µIU/mL | <5 µIU/mL |
| hsCRP | <3.0 mg/L | <1.0 mg/L |
The difference between these ranges represents the gap between “not sick” and “performing at your best.” Health reports targeting optimal zones help you close that gap systematically.
Pro Tip: Don’t panic if you’re outside optimal ranges initially. These targets represent aspirational goals. Progress happens in stages, and even small improvements deliver measurable benefits in energy, recovery, and metabolic function.
The data backs this up. 60% lower biological age is achievable when optimizing based on health reports rather than just avoiding disease thresholds. That’s the difference between maintaining baseline health and actively reversing aging markers.
Understanding biomarker testing for aging reveals how these optimal targets directly influence longevity outcomes. It’s not just about living longer. It’s about maintaining peak function for decades longer than average.
This is why optimal matters. Standard ranges keep you out of the hospital. Optimal ranges keep you competitive, energized, and resilient.
How health reports turn data into action plans
Raw biomarker numbers mean nothing without context and direction. The real value of health reports lies in their ability to transform lab results into prioritized, actionable steps you can implement immediately.
Methodologies involve AI algorithms analyzing data with wearables and DNA, creating nutrition, supplement, and exercise plans prioritized by impact score. Longitudinal tracking reveals health trends that single tests miss entirely. Here’s how the process works:
- Data collection: Blood draw captures current biomarker levels
- Contextualization: Algorithms compare your results against optimal ranges adjusted for your age, gender, and goals
- Integration: Wearable data, genetic information, and lifestyle inputs add layers of context
- Prioritization: AI ranks recommendations by potential impact, focusing your effort where it matters most
- Tracking: Follow-up tests reveal trends, validating what’s working and adjusting what isn’t
This systematic approach eliminates guesswork. Instead of trying random supplements or diet changes, you target specific deficiencies and imbalances with precision.
The key insight here is that trends matter more than snapshots. A single elevated cortisol reading might reflect a stressful week. Three consecutive tests showing rising cortisol reveal a chronic stress pattern requiring intervention. At-home blood testing makes regular monitoring practical and affordable.
“Longitudinal consistency trumps intensity for meaningful metabolic shifts. Small, sustained changes compound into dramatic improvements over months.”
The combination of AI in health reports and expert review creates a powerful feedback loop. AI identifies patterns and generates recommendations at scale, while human oversight ensures clinical relevance and safety.
Tracking longevity biomarkers for action over time reveals which interventions move the needle. You’re not guessing. You’re measuring, adjusting, and validating progress with objective data.
Limitations and caution: Getting context right
Health reports are powerful tools, but they’re not magic. Understanding their limitations prevents common mistakes and ensures you use them wisely.
Biomarkers are signals, not diagnoses. An elevated hsCRP indicates inflammation, but it doesn’t tell you whether the cause is poor sleep, gut issues, or overtraining. LLM-based tools can outperform open-source algorithms but often fail clinical validation. Over-reliance on numbers can trigger anxiety or false positives if not guided by context and expert review.
Here are common pitfalls to avoid:
- Single-test conclusions: One abnormal result doesn’t define a trend. Retest before making major changes.
- Ignoring context: Biomarkers fluctuate based on sleep, stress, recent meals, and exercise. Timing matters.
- Self-diagnosis: Elevated markers warrant investigation, not panic. Work with qualified professionals to interpret results.
- Chasing perfection: Optimal ranges are targets, not requirements. Progress beats perfection every time.
- Overlooking lifestyle factors: No supplement fixes poor sleep, chronic stress, or a terrible diet. Fundamentals come first.
“Numbers without context create noise, not insight. The best health reports combine data with expert interpretation to reveal actionable patterns.”
AI-generated recommendations are powerful starting points, but clinical or expert confirmation remains vital. Some algorithms lack validation in diverse populations, and individual responses to interventions vary widely.
Understanding biomarkers for disease prevention requires balancing data-driven insights with clinical judgment. Use health reports as one tool in your optimization toolkit, not the only tool.
Pro Tip: Always retest after implementing changes. This validates whether your interventions are working and prevents you from wasting time on ineffective strategies.
How to get started with health reports for your goals
Ready to move from theory to action? Here’s your roadmap for leveraging health reports to optimize performance and longevity.
- Assess your goals: Define what you’re optimizing for. Performance? Longevity? Disease prevention? Your priorities shape which biomarkers matter most.
- Choose a provider: Look for services offering optimal ranges, trend tracking, and expert validation. Transparency about methodology and data sources is crucial.
- Prepare for testing: Fast 12 hours before blood draw. Avoid intense exercise 24 hours prior. Test at consistent times for accurate comparisons.
- Interpret results: Focus on markers outside optimal ranges first. Understand what each biomarker reveals about your current state.
- Implement recommendations: Start with high-impact changes. Prioritize sleep, nutrition, and stress management before adding supplements.
- Track and adjust: Retest every 3-6 months. Compare trends, not single values. Adjust your approach based on what the data reveals.
When evaluating providers, prioritize these features:
- Optimal range targeting beyond standard reference values
- Longitudinal tracking that reveals trends over time
- Expert validation of AI-generated recommendations
- Integration capabilities with wearables and genetic data
- Transparent methodology explaining how recommendations are generated
The wellness market surges as more people use health reports for personalized tracking. Direct-to-consumer options have made advanced biomarker testing accessible to anyone serious about optimization.
The benefits of biomarker testing extend beyond just knowing your numbers. You gain a feedback mechanism that validates your lifestyle choices and reveals hidden opportunities for improvement.
Pro Tip: Start with a comprehensive panel covering metabolic, lipid, inflammation, and nutritional markers. This baseline reveals your biggest opportunities and guides where to focus your effort.
Understanding wellness market trends shows this approach is becoming mainstream. What was once reserved for elite athletes is now accessible to anyone committed to data-driven health optimization.
Start your journey: Unlock personalized insights today
You now understand what health reports reveal, how they work, and why targeting optimal ranges transforms performance and longevity. The next step is putting this knowledge into action with your own personalized data.
Biostarks health reports deliver the precision and clarity you need to optimize your biomarkers systematically. Using advanced Swiss mass spectrometry, we analyze the markers that matter most for performance, recovery, and metabolic function. Our reports don’t just show you numbers. They provide prioritized action plans tailored to your unique profile, goals, and lifestyle.
Whether you’re an athlete chasing peak performance, a biohacker focused on longevity, or simply someone who refuses to settle for average health, personal health reporting insights give you the roadmap to get there. Start tracking, start optimizing, and start seeing measurable improvements in how you feel and perform.
Frequently asked questions
How often should I retest my biomarkers with a health report?
Most experts recommend testing every 3-6 months to track trends and make meaningful changes. Longitudinal tracking reveals trends over repeat tests every 3 to 6 months, giving you the data needed to validate interventions and adjust your approach.
Can health reports replace visits to my doctor?
No, health reports are best used as a tool for self-optimization and should complement medical guidance. Biomarkers signal not diagnose, so clinician oversight is essential for interpreting results in the context of your complete health picture.
What’s the difference between optimal and reference ranges?
Optimal ranges are personalized targets for peak health, while reference ranges are for basic disease screening. Optimal targets like HOMA-IR below 1.0, TG/HDL ratio under 0.87, and Vitamin D between 40 and 60 ng/mL go beyond reference ranges to support performance and longevity.
Are AI-driven recommendations safe to follow?
AI offers powerful insights but should be reviewed by experts, as some tools lack clinical validation. LLMs outperform open-source algorithms but fail validation in some cases, so clinician oversight is crucial before implementing major changes.
Will health reports help me perform better in sports?
Yes, targeted biomarker insights can help you fine-tune nutrition, recovery, and training for improved results. Biomarker tracking supports performance by revealing hidden bottlenecks in energy production, recovery capacity, and adaptation to training stress.


