
TL;DR:
- Standard lab ranges are designed for disease detection, not optimizing athletic performance or longevity.
- Consistent sample preparation and tracking trends over time are key for reliable blood biomarker insights.
- Monitoring personalized data helps athletes optimize performance and detect early health issues before they manifest.
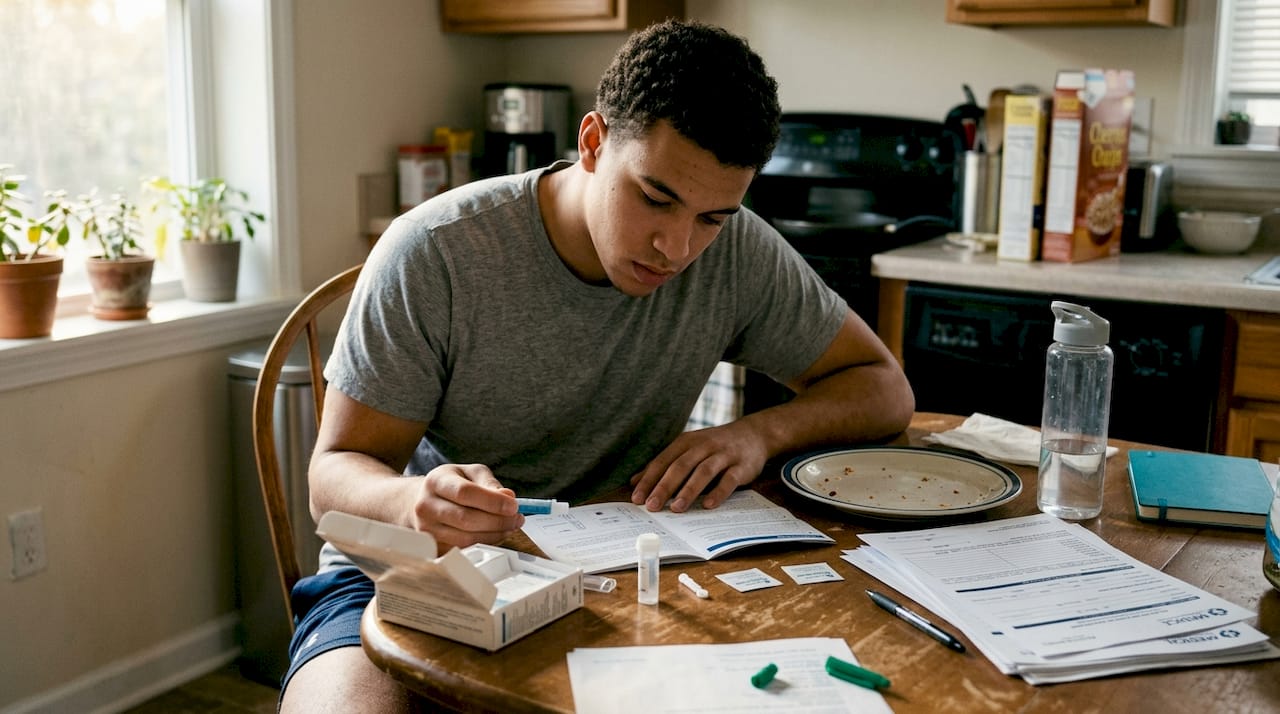
Most athletes and health-conscious individuals get their blood results back, see “normal” next to every value, and assume everything is fine. But standard lab reference ranges are built to detect disease in the general population, not to guide peak performance or long-term vitality. That gap between “not sick” and “truly optimized” is where real gains are lost. This guide walks you through how to analyze blood markers with precision: what to test, how to prepare, how to interpret key values, and how to use trends over time to make smarter decisions about your training, nutrition, and longevity.
Table of Contents
- Understanding blood marker roles: screening vs. performance monitoring
- How to prepare and collect blood samples for reliable results
- Interpreting key blood markers for athletes and longevity
- Tracking trends, acting on results, and collaborating with experts
- Why personal trends beat lab averages every time
- Take the next step in blood marker analysis
- Frequently asked questions
Key Takeaways
| Point | Details |
|---|---|
| Trends over snapshots | Long-term tracking of your blood markers is more valuable than a single test result. |
| Personalized ranges matter | Rely on athlete- or individual-specific optimal ranges instead of generic lab references. |
| Consistent testing conditions | Always fast, hydrate consistently, and collect samples at similar times for reliable results. |
| Act on patterns, not one-offs | Respond to consistent patterns in your blood markers, not to isolated changes. |
Understanding blood marker roles: screening vs. performance monitoring
Not all blood testing serves the same purpose. There’s a meaningful difference between screening for health risks and actively monitoring your body’s adaptation to training stress. Confusing the two leads to either undertesting (missing early warning signs) or overtesting without a clear strategy.
Screening is typically a quarterly check for deficiencies like iron or vitamin D, while biomarker-based training may require monitoring every 3-10 days using individualized ranges during heavy training blocks. That frequency difference exists because performance monitoring tracks real-time adaptation, not just disease risk.
Here’s a quick comparison:
| Purpose | Frequency | Key markers | Range type |
|---|---|---|---|
| Health screening | Quarterly | Iron, vitamin D, CBC | Population reference |
| Performance monitoring | Every 3-10 days | Ferritin, hsCRP, cortisol | Individualized baseline |
| Longevity tracking | Monthly to quarterly | ApoB, Lp(a), insulin | Optimal, not just normal |
Population reference ranges are calculated from large groups that include sedentary, overweight, or metabolically compromised individuals. When your lab report says your ferritin is “normal,” that normal might be perfectly fine for a desk worker but inadequate for someone running 60 miles a week. Understanding the types of biomarkers and how they serve different goals is the first step toward using data effectively.
Key distinctions to keep in mind:
- Screening catches deficiencies and disease risk at a population level
- Performance monitoring tracks your personal response to training load
- Longevity tracking focuses on slow-moving markers like cardiovascular risk and metabolic function
- Trends over multiple tests reveal patterns that a single reading will always miss
“A single data point is a photograph. A series of results over time is a film. Only the film tells the real story.”
The shift from thinking about blood tests as a one-time checkup to treating them as an ongoing data stream is what separates reactive health management from proactive optimization.
How to prepare and collect blood samples for reliable results
Clean data starts before the needle ever touches your skin. The preparation phase is where most people unknowingly introduce noise into their results, and that noise can lead to misinterpretation and poor decisions.
Proper sample collection requires fasting, consistent posture, and stable hydration. Factors like acute inflammation from a hard workout can falsely elevate markers like ferritin or hsCRP, making you look inflamed when you’re simply recovering. Timing and context matter enormously.
Follow these steps every time you test to ensure your results are comparable:
- Fast for 8-12 hours before your draw. Water is fine; coffee and supplements are not.
- Test at the same time of day, ideally between 7-9 AM, when cortisol and hormones are at their natural peak.
- Avoid intense exercise for at least 24-48 hours before testing. Hard training elevates inflammatory markers and can temporarily suppress testosterone.
- Stay well hydrated the evening before. Dehydration concentrates your blood and can skew cell counts and lipid panels.
- Sit quietly for 10-15 minutes before your draw. Standing or lying down changes plasma volume and can alter results.
- Avoid acute illness. Testing while sick introduces inflammatory noise that makes your results nearly uninterpretable.
For athletes using at-home biomarker testing, the convenience is significant, but consistency is everything. The value of home testing comes from repeated, comparable measurements, not one-off snapshots.
| Variable | Recommended condition | Impact if ignored |
|---|---|---|
| Fasting | 8-12 hours | Skewed glucose, lipids |
| Exercise timing | 24-48 hours rest | Elevated CRP, low testosterone |
| Hydration | Well-hydrated | Concentrated blood markers |
| Time of day | 7-9 AM | Hormonal variation |
Pro Tip: Keep a simple testing log. Note your sleep hours, stress level, and last workout before each draw. When results look unusual, that log will tell you why.
Interpreting key blood markers for athletes and longevity
Once you’ve collected quality data, the real work begins. Knowing what each marker means in the context of your performance and long-term health is where most people need the clearest guidance.
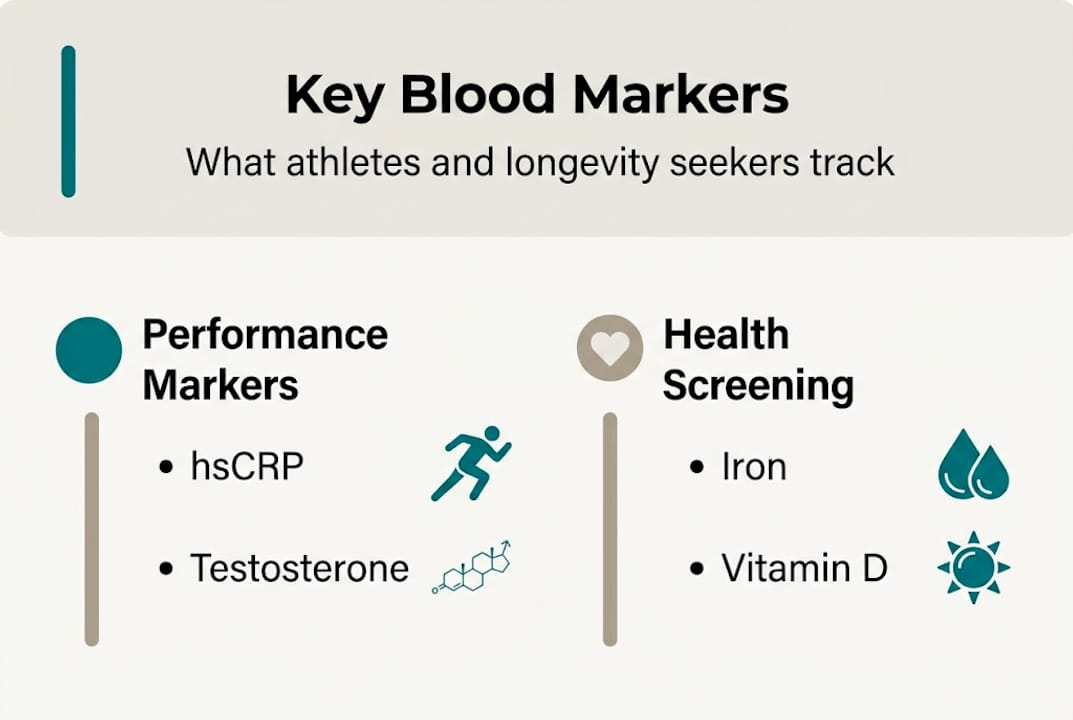
Here are the markers that matter most:
- Ferritin: Your iron storage marker. Optimal ferritin for athletes sits between 65-150 ng/mL. Below 30 ng/mL signals deficiency even if your hemoglobin looks fine. Low ferritin tanks endurance and cognitive sharpness before anemia ever shows up on a standard panel.
- hsCRP (high-sensitivity C-reactive protein): A marker of systemic inflammation. Below 1 mg/L is ideal for performance and longevity. Chronically elevated hsCRP, even at 2-3 mg/L, signals that recovery is compromised or that something in your lifestyle is driving low-grade inflammation.
- Testosterone (total and free): Critical for recovery, muscle synthesis, and mood. Lab “normal” ranges are broad. An athlete at the bottom of normal may still feel and perform suboptimally.
- ApoB: A far better cardiovascular risk marker than LDL cholesterol. ApoB counts every atherogenic particle, giving you a more accurate picture of arterial risk.
- Lp(a): Largely genetic and often overlooked. Elevated Lp(a) significantly increases cardiovascular risk independent of other lipid markers.
- Insulin sensitivity (fasting insulin + glucose): The foundation of metabolic health. Fasting insulin above 10 uIU/mL often signals early insulin resistance, even when fasting glucose looks normal.
Using athlete-specific optimal ranges rather than standard lab reference ranges is non-negotiable if you’re serious about performance. The top longevity biomarkers overlap significantly with performance markers, which is why athletes who optimize for performance often age exceptionally well. Explore the biomarker benefits for athletes to see how these markers connect across goals.
Pro Tip: Never act on a single abnormal value. One elevated hsCRP after a brutal training week is expected. Three consecutive elevated readings signal a real problem worth investigating.
Tracking trends, acting on results, and collaborating with experts
Understanding individual markers is necessary but not sufficient. The real power comes from tracking how those markers move over time and integrating that data with everything else you know about your body.
Here’s a practical system for turning blood data into action:
- Build a personal baseline over your first 2-3 tests. This is your reference point, not the lab’s population average.
- Graph your key markers across time. A simple spreadsheet works. Visual trends reveal what tables of numbers hide.
- Set personal alert thresholds. If your ferritin drops below 70 ng/mL, that’s your cue to review iron intake and training load before it becomes a problem.
- Cross-reference with training data. A drop in HRV alongside rising hsCRP and falling testosterone is a clear signal of accumulated stress, not a coincidence.
- Adjust before you crash. The goal is to catch trends early and make small corrections rather than waiting for a dramatic decline.
When to bring in expert support:
- Rapid shifts in multiple markers simultaneously
- Persistent abnormalities that don’t resolve with lifestyle adjustments
- Mixed signals where markers point in conflicting directions
- Planning major training or dietary changes
Combining blood results with training data like HRV and RPE gives you context that neither source provides alone. A sports nutritionist or physician who understands performance physiology can help you interpret nuanced patterns. For longevity and performance, prioritizing metabolic, inflammation, and cardiovascular risk markers and tracking them longitudinally is the most reliable path to early detection and long-term optimization.
Understanding the role of biomarkers in your overall health picture and knowing why biomarker insights matter will sharpen how you act on every result.
“Avoid over-reliance on single snapshots; combine with training data for context.”
Why personal trends beat lab averages every time
Here’s an uncomfortable truth: the reference ranges printed on your lab report were never designed to help you perform better. They were designed to identify people who are sick enough to need medical attention. That’s a completely different goal.
Years of working with athlete-driven biomarker data consistently show that the individuals who improve most are those who stop chasing “normal” and start tracking their own baseline. Your ferritin at 80 ng/mL might be your personal sweet spot. Someone else might feel their best at 110. Neither of those facts shows up in a population average.
Standard lab ranges miss optimization; personalized trends are what actually move the needle for performance and longevity. When you track consistently, small shifts become early signals rather than surprises. A gradual decline in testosterone over six months is invisible in a single test but obvious in a trend line. That early visibility is what allows you to act before performance suffers.
Personalized tracking also builds a kind of health literacy that no single test can provide. You start to recognize your patterns, understand your responses to training and nutrition, and make decisions based on evidence rather than guesswork. Explore wellness optimization strategies to see how this approach fits into a broader health system.
Pro Tip: When your data starts to shift, treat it as an early signal to review your recovery, nutrition, or training load before the shift becomes a real problem.
Take the next step in blood marker analysis
You now have a framework for moving beyond standard lab reports and into genuinely personalized health optimization. Knowing what to test, how to prepare, and how to read trends over time puts you ahead of the vast majority of people who get blood work done once a year and never look deeper.
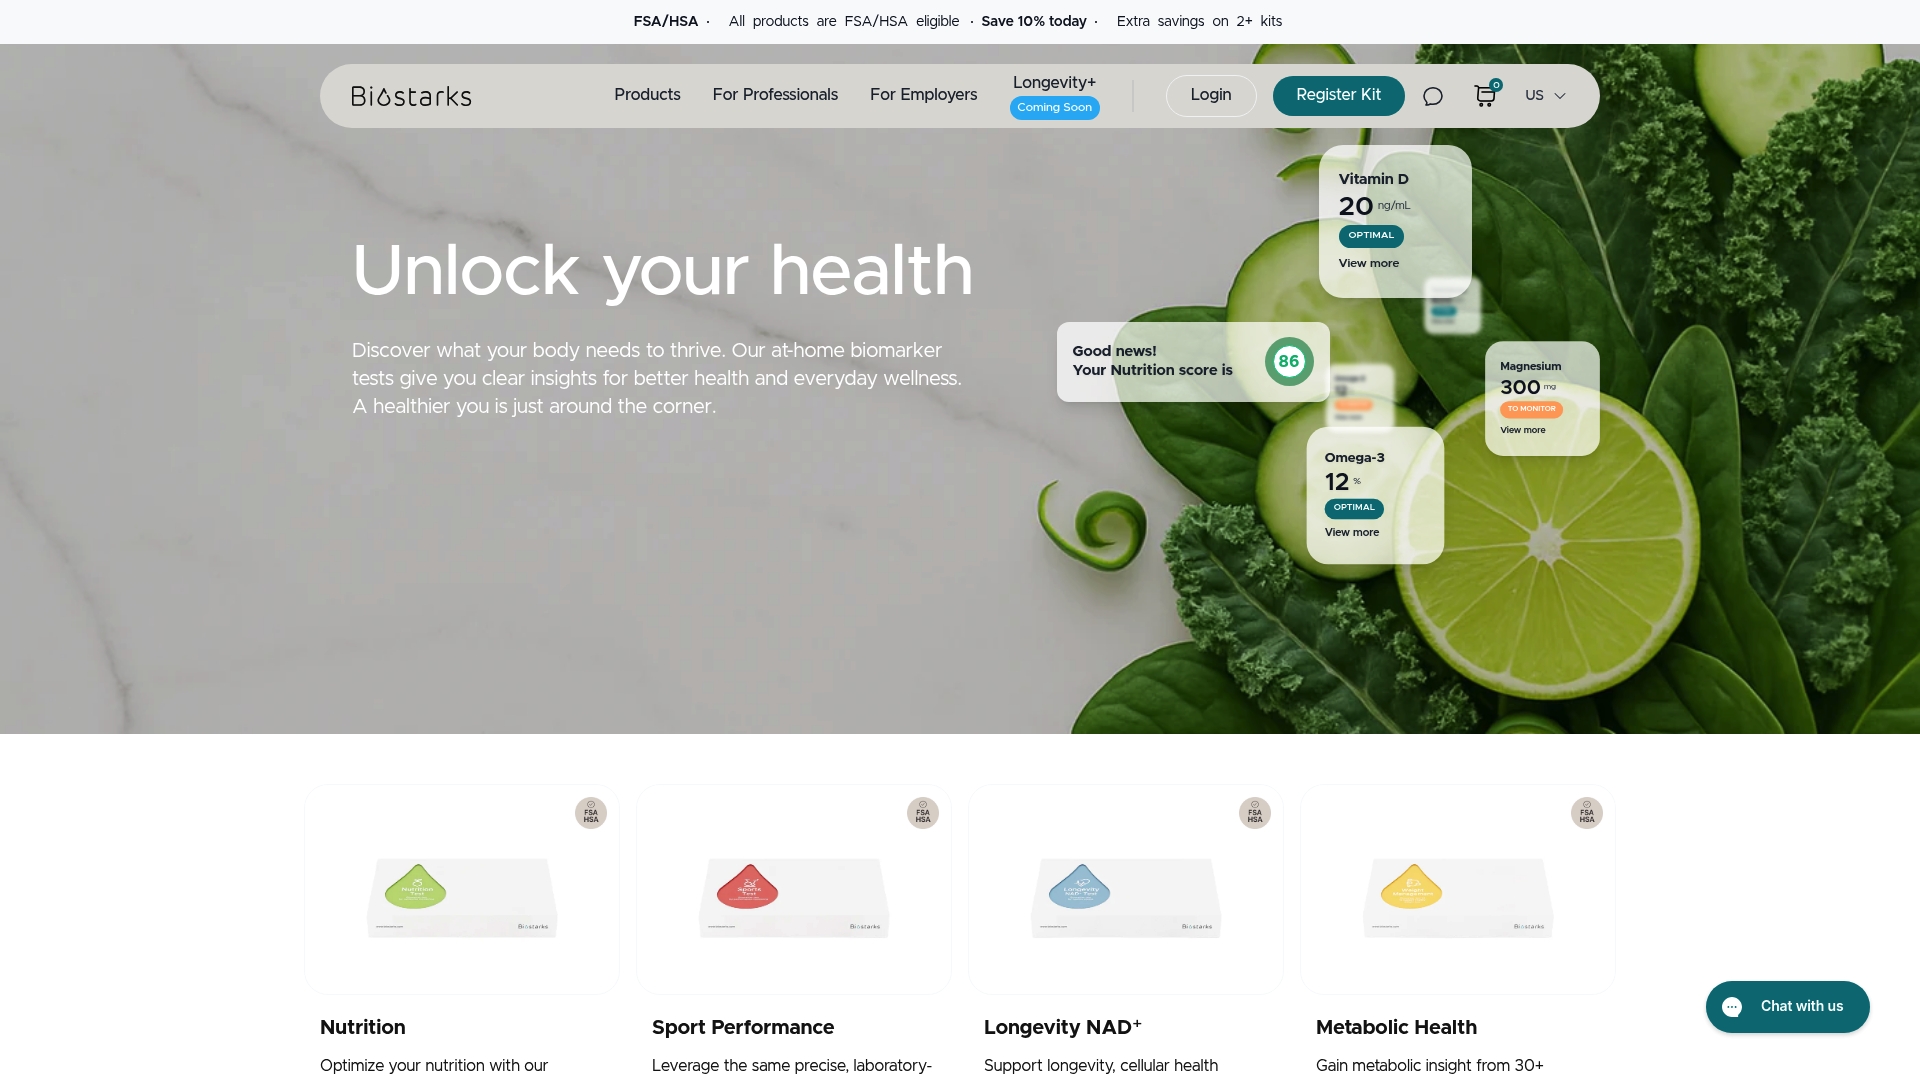
Biostarks makes this process precise and accessible. Our advanced at-home biomarker testing uses Swiss mass spectrometry to analyze the markers that matter most for performance and longevity, delivering reports that go beyond reference ranges and give you actionable insights tied to your personal baseline. Whether you’re an athlete optimizing recovery or someone building a long-term health strategy, explore Biostarks to discover testing options built for serious health optimization.
Frequently asked questions
What are the most important blood markers to track for athletes?
Key markers include ferritin, hsCRP, testosterone, ApoB, Lp(a), and insulin sensitivity. Prioritizing metabolic, inflammation, and cardiovascular risk markers and tracking trends over time gives you the clearest picture of both performance and longevity risk.
How often should I test my blood markers?
Screen quarterly for deficiencies like iron or vitamin D, and monitor performance markers every 3-10 days during intensive training blocks. Frequency depends on your training phase and the specific markers you’re tracking.
How can I make sure my blood test results are accurate?
Always fast for 8-12 hours, test at the same time of day, and maintain consistent hydration and posture. Optimal collection conditions are the single biggest factor in result reliability.
What should I do if my blood marker is out of range?
Don’t act on a single abnormal result. Look for patterns across multiple tests, then consult a sports physician or nutritionist. Combining results with training data like HRV and RPE gives you the context needed to make smart decisions.
Do standard lab ranges work for high-performing individuals?
Standard ranges identify disease, not optimization. Personalized trends outperform population averages for athletes and health-focused individuals who want to operate at their best, not just avoid illness.
Recommended
- Examples of metabolic markers to optimize hea… | Biostarks
- Role of Biomarkers in Health Optimization | Biostarks
- Functional health biomarkers list for optimal… | Biostarks
- Metabolic health optimization with biomarkers… | Biostarks
- Health Marker Screening Test Kits | At-Home Wellness Tests – RapidTest.co


