

TL;DR:
- A metabolic panel assesses organ function, chemical balance, and metabolism through blood measurements to detect health conditions. Reading patterns and trends over time gives more meaningful insights than isolated values, especially with proactive monitoring. At-home testing platforms like Biostarks enable longitudinal tracking, improving health management through consistent data collection.
A metabolic panel is a blood test that measures multiple substances in your blood to assess metabolism, organ function, and chemical balance. Explaining metabolic panels clearly matters because these tests are among the most ordered lab panels in clinical medicine, yet most people receive their results without a clear framework for understanding them. The two standard types are the Comprehensive Metabolic Panel (CMP) and the Basic Metabolic Panel (BMP). Together, they screen for conditions ranging from diabetes and kidney disease to liver dysfunction and electrolyte imbalances. This article walks you through every component, what the numbers mean, and how to use that information for your own health.
What does a metabolic panel measure?
A CMP includes 14 measurements covering blood sugar, kidney function, electrolytes, liver enzymes, proteins, and calcium. That breadth is exactly what makes it useful as a first-pass screening tool. The BMP covers 8 of those same markers, focusing on metabolic and kidney status without the liver function add-ons.

The CMP adds six markers to the BMP: ALT, AST, alkaline phosphatase, total bilirubin, albumin, and total protein. Those six additions shift the panel from a metabolic snapshot to a fuller picture of organ health.
The 14 CMP markers and their normal ranges
Here is how the 14 markers break down by function, along with standard adult reference ranges:
| Marker | Function | Normal Adult Range |
|---|---|---|
| Glucose | Blood sugar regulation | 70–100 mg/dL |
| BUN (Blood Urea Nitrogen) | Kidney waste filtration | 7–20 mg/dL |
| Creatinine | Kidney filtration rate | 0.6–1.3 mg/dL |
| Sodium | Fluid and nerve balance | 135–145 mEq/L |
| Potassium | Heart and muscle function | 3.5–5.0 mEq/L |
| Chloride | Acid-base and fluid balance | 98–106 mEq/L |
| CO2 (Bicarbonate) | Acid-base buffering | 22–29 mEq/L |
| ALT | Liver cell health | 4–36 U/L |
| AST | Liver and muscle injury | 10–40 U/L |
| Alkaline Phosphatase | Bile duct and bone function | 44–147 U/L |
| Total Bilirubin | Liver processing of red blood cells | 0.1–1.2 mg/dL |
| Albumin | Protein and nutritional status | 3.4–5.4 g/dL |
| Total Protein | Overall protein synthesis | 6.3–8.2 g/dL |
| Calcium | Bone, nerve, and muscle function | 8.5–10.2 mg/dL |
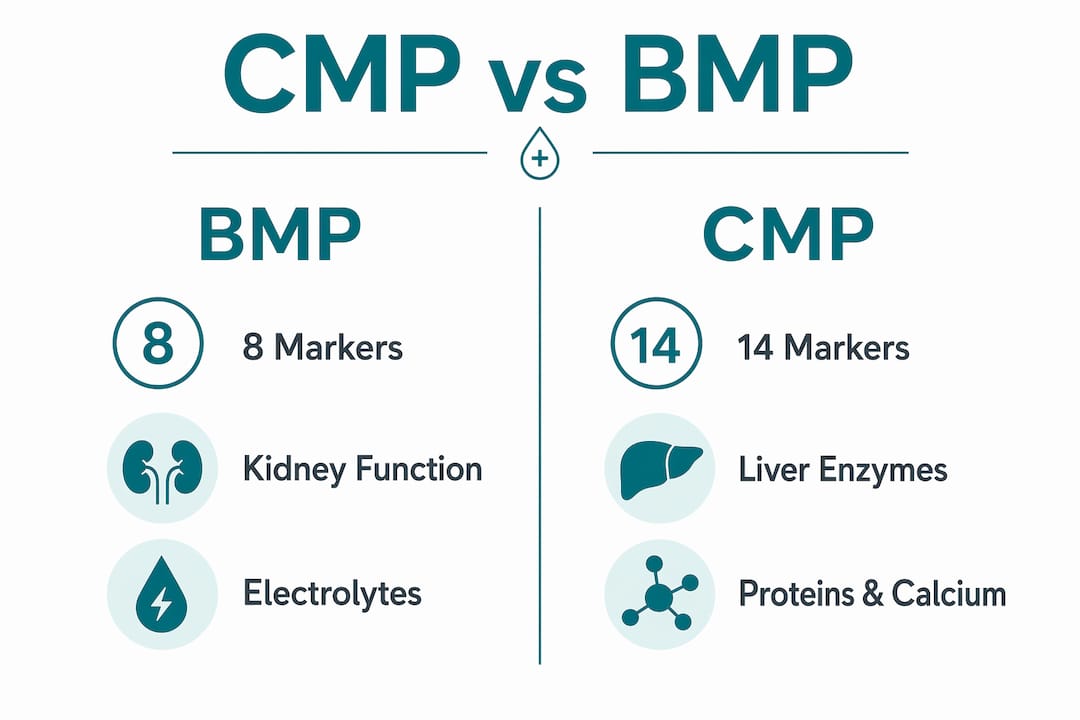
BMP vs. CMP: which panel do you need?
The BMP is typically ordered for quick metabolic checks, such as monitoring blood sugar or kidney function in a patient already on medication. The CMP is preferred when a clinician wants a broader picture, particularly when liver disease, malnutrition, or unexplained fatigue is a concern. If you are tracking your health proactively, the CMP gives you significantly more data per draw.
Electrolytes in the panel include sodium, potassium, chloride, and bicarbonate. These four markers regulate fluid balance, nerve signaling, and acid-base status. An imbalance in any one of them can signal dehydration, kidney problems, or a medication side effect before you feel any symptoms.
Liver enzymes ALT, AST, alkaline phosphatase, and bilirubin assess liver cell injury, bile duct function, and bilirubin processing. Elevations in these markers suggest liver disease, bile duct obstruction, or hemolysis. You cannot feel early liver stress, which is exactly why these markers earn their place on the panel.
Albumin and total protein inform on nutritional status, liver function, and hydration. Low albumin, for example, can reflect chronic inflammation, kidney protein loss, or inadequate dietary protein, three very different problems that require different responses.
Pro Tip: Ask your doctor for both your current results and your results from 12 months ago. A single value tells you where you are. Two values tell you which direction you are moving.
How do you interpret metabolic panel results?
Reading a metabolic panel correctly means looking at clusters of markers, not reacting to a single flagged value. Providers assess patterns rather than reacting to single value changes. That distinction matters because one mildly elevated creatinine in an otherwise normal panel reads very differently than elevated creatinine alongside high BUN and low CO2.
Key marker patterns to recognize
- Kidney stress pattern: BUN and creatinine both elevated, CO2 low. This cluster suggests reduced kidney filtration and possible acid buildup. Dehydration, high protein intake, or early kidney disease can all produce this pattern.
- Liver injury pattern: ALT and AST both elevated, especially with rising bilirubin. This points toward active liver cell damage. Alcohol, medications, or viral hepatitis are common triggers.
- Electrolyte imbalance pattern: Low sodium with low chloride and low CO2 often signals overhydration or kidney dysfunction. High potassium alongside low CO2 can indicate acidosis.
- Nutritional depletion pattern: Low albumin with low total protein, especially when glucose is also low, suggests inadequate intake or malabsorption.
- Isolated mild elevation: A single marker slightly outside range, with all others normal, is often a lab variation, hydration artifact, or medication effect rather than a disease signal.
Sophisticated panel reading integrates multiple markers simultaneously, using ratios like BUN-to-creatinine for hydration and kidney status, and ALT-to-AST ratios for liver pathology type. A BUN-to-creatinine ratio above 20 typically suggests dehydration or high protein catabolism. A ratio below 10 can point toward liver disease or low protein intake.
Reference ranges vary by lab, testing method, and patient demographics. Clinicians evaluate trends over time rather than relying solely on single results. This is why a result labeled “high” on your lab report may not require any action if your trend over three panels has been stable.
Abnormal CMP results often require follow-up testing or longitudinal monitoring rather than immediate diagnosis. Additional tests may include specialized enzyme panels, imaging, or repeat draws at 30 or 90 days. Think of the CMP as a map that shows you where to look, not a verdict.
Pro Tip: Before your next panel, write down any new medications, supplements, or major dietary changes from the past 30 days. Share that list with your clinician. Context transforms a confusing result into a clear one.
What conditions and lifestyle factors affect your results?
Metabolic panels detect early signs of diabetes, kidney disease, liver dysfunction, electrolyte imbalances, and metabolic stress. These are not rare conditions. They are the most common chronic diseases in the United States, and they often develop silently for years before causing symptoms.
Several medical conditions directly shift your panel values:
- Type 2 diabetes: Fasting glucose above 100 mg/dL signals impaired regulation. Glucose above 126 mg/dL on two separate draws meets the diagnostic threshold.
- Chronic kidney disease: Progressive rise in BUN and creatinine, often paired with declining CO2, reflects reduced filtration capacity over time.
- Liver disease: Persistent elevation of ALT, AST, and bilirubin, particularly when albumin begins to fall, indicates advancing hepatic dysfunction.
- Adrenal disorders: Abnormal sodium and potassium ratios can reflect cortisol dysregulation or aldosterone imbalance.
Lifestyle factors shift results just as powerfully as disease states. Dehydration concentrates BUN and creatinine, making kidney function appear worse than it is. A high-protein diet raises BUN independently of kidney function. Intense exercise elevates AST and creatinine because muscle breakdown releases both. Certain medications, including statins, NSAIDs, and diuretics, alter liver enzymes, creatinine, and electrolytes respectively.
Muscle mass also matters. Creatinine is a byproduct of muscle metabolism, so athletes and individuals with high lean mass naturally run higher creatinine levels. A creatinine of 1.2 mg/dL in a 200-pound athlete is not the same clinical signal as 1.2 mg/dL in a sedentary 130-pound individual. Your clinician needs that context to interpret the number accurately.
How can metabolic panels support personal health monitoring?
Periodic metabolic panel testing is one of the most cost-effective tools for proactive health management. Here is a practical framework for using your results:
- Establish a baseline. Get your first CMP when you are healthy and not acutely ill. That baseline becomes your personal reference point, more relevant than population averages.
- Test at consistent intervals. Annual testing works for most healthy adults. Quarterly testing makes sense if you are managing a chronic condition, changing medications, or following a significant dietary intervention.
- Track glucose and kidney markers first. These are the earliest indicators of metabolic dysfunction and respond fastest to lifestyle changes like diet, hydration, and exercise.
- Watch liver enzymes if you take supplements or medications. Many over-the-counter products, including high-dose niacin, acetaminophen, and herbal extracts, stress the liver at doses people consider routine.
- Pair your panel with context. Log your sleep, hydration, training load, and diet in the week before your draw. Patterns in your lifestyle data explain patterns in your lab data.
At-home biomarker testing has made this kind of longitudinal tracking far more accessible. Platforms like Biostarks, an AMR Labs SA company, use advanced mass spectrometry to analyze metabolic markers from a simple at-home sample. That means you can track your metabolic health markers across time without scheduling repeated clinic visits. The result is a data-driven picture of your health trajectory, not just a single snapshot.
For a deeper look at building a personal monitoring strategy, Biostarks’ guide to at-home biomarker testing walks through how to integrate panel results with lifestyle data for meaningful health decisions.
Key takeaways
A metabolic panel is most useful when you read it as a pattern of interconnected markers over time, not as a list of isolated pass-or-fail values.
| Point | Details |
|---|---|
| CMP covers 14 markers | It measures blood sugar, kidney function, electrolytes, liver enzymes, proteins, and calcium in one draw. |
| BMP vs. CMP distinction | The BMP covers 8 core markers; the CMP adds 6 liver and protein markers for a broader organ health picture. |
| Pattern reading beats single flags | Clusters like elevated BUN plus creatinine or rising ALT plus AST carry more diagnostic weight than any one value alone. |
| Context changes interpretation | Hydration, medications, muscle mass, and diet all shift lab values independently of disease. |
| Trend analysis is the goal | A single result is a data point; serial results over months or years reveal your actual metabolic trajectory. |
Why the numbers on your lab report are just the starting point
I have spent years looking at metabolic panel data, and the most common mistake I see is treating a flagged value as a verdict. Someone gets a creatinine of 1.4 mg/dL, reads “high” next to it, and spends a week convinced their kidneys are failing. In most cases, they were dehydrated the morning of the draw, or they had an intense workout two days before.
The number is real. The alarm is not always warranted.
What I find genuinely useful is the shift that happens when people start tracking their panels over time. A glucose of 98 mg/dL means almost nothing in isolation. But if your glucose was 82 mg/dL two years ago, 89 mg/dL last year, and 98 mg/dL today, that upward trend inside the “normal” range is a signal worth acting on. No single result would have flagged it. The trend makes it visible.
The other thing I push back on is the idea that metabolic panels are only for sick people. They are actually most valuable when you are healthy, because that is when your baseline is clean and your trends are interpretable. Once a chronic condition is established, the panel becomes reactive. Used proactively, it gives you years of lead time.
My practical advice: bring your results to your clinician with a written list of your recent lifestyle changes. Ask specifically about your trends, not just your current values. And if you are using an at-home testing platform, make sure it gives you longitudinal tracking, not just a one-time report. The metabolic health optimization value of these panels comes from repetition, not from a single draw.
— Romain
Take your metabolic health further with Biostarks
Understanding your metabolic panel is the first step. Acting on it requires the right data, collected consistently and interpreted with precision. Biostarks, an AMR Labs SA company, offers at-home biomarker testing that goes beyond standard lab panels, analyzing metabolic markers, liver function indicators, proteins, and more using Swiss mass spectrometry technology.
With Biostarks, you collect your sample at home and receive a detailed report that tracks your results over time. That longitudinal view is what turns raw numbers into real health intelligence. Explore the Pro Collection to find the testing panel that fits your health goals, whether you are monitoring metabolic function, optimizing performance, or building a long-term wellness baseline.
FAQ
What is the difference between a BMP and a CMP?
The BMP measures 8 core markers focused on metabolic and kidney status. The CMP includes those same 8 markers plus 6 additional ones covering liver enzymes, bilirubin, albumin, and total protein.
What does a high creatinine level mean on a metabolic panel?
Elevated creatinine can indicate reduced kidney filtration, but it also rises with dehydration, high muscle mass, and intense exercise. Context and trends matter more than a single elevated value.
How often should you get a metabolic panel?
Most healthy adults benefit from annual CMP testing to establish and track their baseline. Individuals managing chronic conditions or significant lifestyle changes may benefit from testing every 3–6 months.
Can a metabolic panel diagnose diabetes?
A metabolic panel measures fasting glucose, which is one component of diabetes screening. A fasting glucose above 126 mg/dL on two separate draws meets the diagnostic threshold, but a full diabetes workup typically includes HbA1c testing as well.
Are at-home metabolic panel tests as accurate as clinic tests?
At-home tests using validated laboratory methods, including mass spectrometry as used by Biostarks, produce clinically comparable results. Accuracy depends on proper sample collection and the analytical method used by the testing provider.
This content is for educational purposes only and does not constitute medical advice. Always consult with a healthcare professional before making changes to your health regimen.


