
TL;DR:
- AI-based biomarker analytics can now predict mortality risk more accurately than chronological age.
- Regular, focused testing combined with trend analysis enables personalized longevity interventions.
- Most effective strategies include diet, metabolic, and inflammation-based modifications guided by specific biomarker targets.
Most people assume longevity is mostly about genetics or a handful of lifestyle habits. That framing misses something fundamental. Biological age prediction using AI and machine learning on biomarkers like epigenetic clocks is now more accurate at forecasting mortality risk than your chronological age. This article walks through how analytics has transformed longevity science, which biomarkers actually move the needle, how platforms convert raw data into real interventions, and why most advice in this space still gets it wrong. If you are serious about optimizing healthspan, not just lifespan, this is where to start.
Table of Contents
- The evolution of longevity science: From guesswork to precision analytics
- What biomarkers matter most for longevity—and why
- How analytics turns data into action: From dashboards to interventions
- Personalizing longevity: Precision interventions and real-world results
- Why most longevity analytics advice misses the mark—and what actually works
- Unlock your longevity potential with at-home analytics
- Frequently asked questions
Key Takeaways
| Point | Details |
|---|---|
| Analytics outperforms guesses | Machine learning on biomarkers predicts aging and disease risks more accurately than traditional methods. |
| Focus on actionable biomarkers | Prioritize Tier-1 blood markers and epigenetic clocks, and track trends for optimal health decisions. |
| Turn data into action | Modern platforms and dashboards make complex results clear, guiding real-world changes for better outcomes. |
| Personalize for real results | Combine data-driven dietary, lifestyle, and intervention strategies for the greatest longevity impact. |
| Quality over quantity | Routine, context-aware testing provides more value than obsessively tracking every available metric. |
The evolution of longevity science: From guesswork to precision analytics
For most of medical history, longevity advice was population-level at best. Eat less, move more, sleep well. Useful, but blunt. The same recommendation applied to a 35-year-old endurance athlete and a sedentary 60-year-old with metabolic syndrome. That gap between population averages and individual biology is exactly where modern analytics steps in.
The shift began when researchers started applying machine learning to large biomarker datasets. Instead of asking “what do most healthy people do,” the question became “what does your biology actually show?” AI methodologies now include supervised learning models like random forests and deep neural networks, multimodal data fusion, digital twin simulations for testing interventions before you try them, and platforms that integrate wearables, continuous glucose monitors, and lab results into real-time dashboards. That is a fundamentally different kind of tool.
“The most important shift in longevity science is not a new drug or protocol. It is the ability to measure biological aging at the individual level and adjust course in real time.”
The practical impact is significant. Digital platforms now give you cohort benchmarking, meaning you can see how your ApoB or fasting insulin compares to people your age with similar health goals, not just a lab’s reference range built from a general population. You can track trends across quarters and years rather than reacting to a single data point. This is where analytics in aging prediction has moved from research novelty to clinical and consumer reality.
| Era | Approach | Limitation |
|---|---|---|
| Pre-2000s | Population guidelines, anecdotal | No individual context |
| 2000s | Basic blood panels + lifestyle scoring | Single snapshots, no trend data |
| 2010s | Wearables + activity tracking | Missing internal biochemistry |
| 2020s | AI-driven biomarker analytics | Integrates labs, wearables, epigenetics |
The table above shows how quickly the tools have matured. Each layer added more resolution. But the real leap came when platforms started synthesizing all of these inputs simultaneously, turning scattered data points into a coherent biological picture.
What biomarkers matter most for longevity—and why
Not all biomarkers are created equal. Some are highly sensitive to acute stress and tell you little about long-term trajectory. Others are remarkably stable predictors of disease risk and lifespan. Knowing the difference is half the battle.
The top longevity biomarkers that consistently show up in the evidence base include:
- ApoB: Target below 80 mg/dL. A far more precise cardiovascular risk marker than LDL cholesterol because it counts every atherogenic particle.
- hs-CRP: Target below 1.0 mg/L. Measures systemic inflammation, one of the strongest drivers of biological aging.
- HbA1c: Target below 5.4%. Reflects average blood glucose over three months. Even modest elevations above this threshold accelerate vascular and neurological aging.
- Fasting insulin: Target between 5 and 7 μIU/mL. Often the earliest signal of metabolic dysfunction, years before HbA1c shifts.
- Epigenetic clocks: GrimAge, PhenoAge, DunedinPACE. DunedinPACE below 1.0 indicates aging slower than your chronological age.
Key longevity biomarkers like ApoB, hs-CRP, HbA1c, fasting insulin, and epigenetic clocks each have specific optimal ranges that go beyond standard lab reference intervals, which are built around average populations rather than optimized longevity targets.
| Biomarker | Standard lab range | Longevity target | Why it matters |
|---|---|---|---|
| ApoB | <100 mg/dL | <80 mg/dL | Cardiovascular particle count |
| hs-CRP | <3.0 mg/L | <1.0 mg/L | Systemic inflammation |
| HbA1c | <5.7% | <5.4% | Glycemic aging signal |
| Fasting insulin | <25 μIU/mL | 5-7 μIU/mL | Earliest metabolic dysfunction |
| DunedinPACE | N/A | <1.0 | Pace of biological aging |
Epigenetic clocks deserve special attention. Second and third-generation clocks like GrimAge v2, PhenoAge, and DunedinPACE significantly outperform first-generation tools in predicting mortality, with C-index scores reaching 0.808. They also show strong hazard ratios for specific diseases: lung cancer at 1.56 and diabetes at 1.44. These are not abstract research metrics. They reflect how much faster or slower your cells are aging relative to your birthday.
The practical question is which tests to run and how often. For most biohackers, a Tier 1 clinical panel every six months and an epigenetic clock annually gives you enough data to identify trends without drowning in noise. You can explore the biomarkers and evidence behind each marker to build a testing schedule that fits your goals and budget.
Pro Tip: Always test under consistent conditions. Fasted in the morning, after a normal week of sleep and activity. One stressful travel week or a recent illness can move hs-CRP and even epigenetic clocks enough to mislead your interpretation.
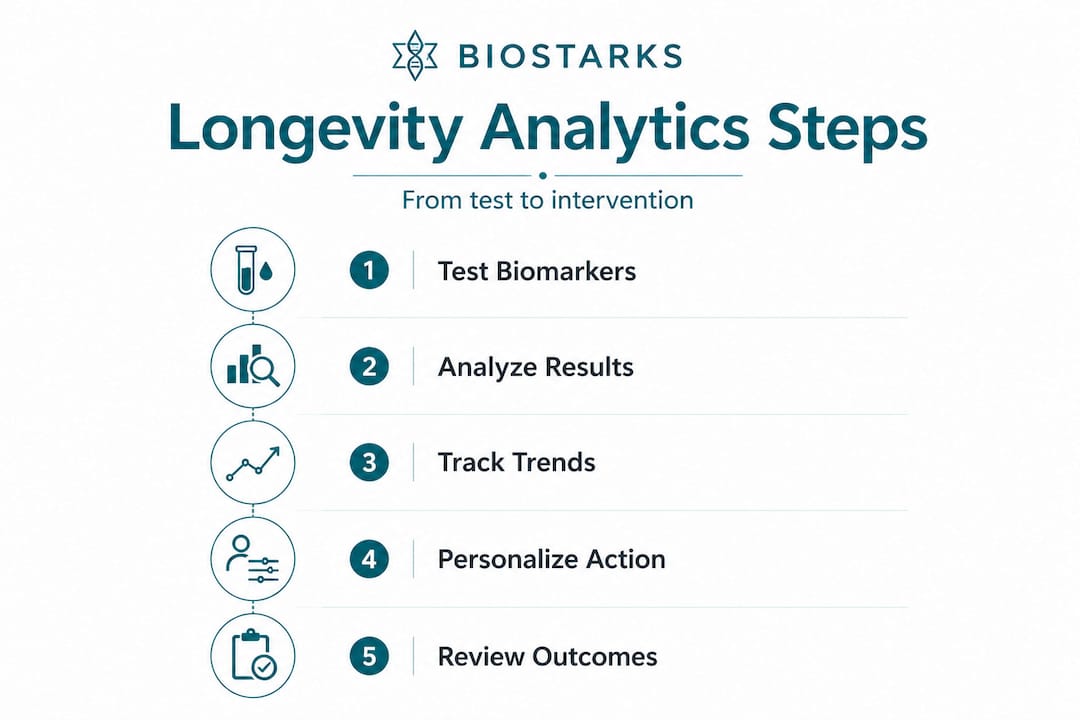
How analytics turns data into action: From dashboards to interventions
Knowing your biomarker numbers is only the first step. The real value comes from what analytics platforms do with those numbers over time. Here is a typical workflow that converts raw data into targeted action:
- Sample collection: At-home blood draw or finger-prick collection, shipped to a certified lab using standardized protocols. This removes the variability of clinic-to-clinic differences.
- Data normalization: Results are standardized against age, sex, and population cohorts so comparisons are meaningful. Raw numbers without context are just noise.
- Trend analysis: A single hs-CRP reading of 1.4 mg/L might be meaningless. Three consecutive readings trending upward over 18 months is a clear signal worth acting on.
- AI-driven flagging: Machine learning models identify which combinations of biomarkers suggest risk patterns that a clinician reviewing a single panel might miss.
- Intervention simulation: Digital twin technology allows platforms to model what happens to your biological age score if you reduce fasting insulin by 30% or lower ApoB through dietary changes, before you commit to a protocol.
- Cohort benchmarking: Platforms like Heads Up normalize wearable and lab data across user populations, giving you real-world context for how your metabolic health compares to peers with similar demographics and goals.
This pipeline transforms the experience of tracking metabolic health from a passive record-keeping exercise into an active feedback loop. You are not just watching numbers. You are running a continuous experiment on your own biology.
Pro Tip: When reviewing your analytics dashboard, focus on the direction of change over at least two consecutive test cycles before making major protocol adjustments. A single outlier reading often reflects a transient stressor rather than a true biological shift.
The metabolic health optimization potential here is substantial. Platforms that integrate continuous glucose monitor data with quarterly lab results can identify, for example, that your HbA1c is technically in range but your CGM shows consistent post-meal spikes that predict future glycemic aging. That kind of layered insight is only possible when analytics connects multiple data streams simultaneously.

Personalizing longevity: Precision interventions and real-world results
Analytics does not just describe your biology. It points toward specific interventions with documented impact. The evidence base here is growing fast, and some of the findings are genuinely surprising.
The Mediterranean diet is one of the most studied dietary patterns in longevity research. It reduces hs-CRP by 18 to 32% and increases microbiome diversity by 6 to 28%. What is particularly striking is the engagement data: digital platforms supporting Mediterranean diet adherence show 58 to 84% user engagement at 12 months, which is far above typical health intervention retention rates. That combination of biological effect and sustained behavior change is rare and worth noting.
Key evidence-backed interventions guided by analytics:
- Reducing dietary saturated fat and refined carbohydrates to lower ApoB and fasting insulin simultaneously
- Time-restricted eating protocols calibrated to CGM data to flatten glucose variability
- Targeted anti-inflammatory nutrition adjustments based on hs-CRP trend data
- Exercise prescription informed by VO2 max testing and heart rate variability trends
- Sleep optimization guided by cortisol and testosterone patterns from quarterly panels
AI is also opening entirely new doors. PDAP1 overexpression has been linked to approximately one year of shorter lifespan in adults over 60. Silencing this gene in model organisms reduces cellular senescence, a major driver of biological aging. This kind of target would never have been found through traditional research methods. It required analyzing massive datasets across thousands of individuals, exactly the kind of work AI-driven analytics makes possible.
There is also an important caveat worth understanding. Life-extending interventions like caloric restriction may in some cases expand the period of morbidity rather than compress it. In mouse studies, animals on caloric restriction lived longer but showed a slower decline in vitality relative to their extended survival period. This matters because adding years without adding healthy years is not the goal. Analytics should track both lifespan markers and healthspan indicators, including functional capacity, inflammation burden, and metabolic resilience, not just survival metrics.
You can see how nutritionists using biomarkers are already applying this layered approach to get better client outcomes, and the same framework applies to self-directed biohackers. Understanding what metabolic health actually means in terms of measurable biomarkers is the foundation for any effective longevity strategy.
Why most longevity analytics advice misses the mark—and what actually works
Here is the uncomfortable truth: more data does not automatically mean better decisions. The longevity analytics space has a real problem with complexity theater, where people track 40 biomarkers, wear three devices simultaneously, and still make the same lifestyle choices they made before. The signal gets buried in the noise.
The biohackers who actually move their biological age markers in a meaningful direction tend to do something counterintuitive. They test less, but more consistently. Tier 1 blood panels every six months and epigenetic clocks annually, under controlled conditions, give you far more actionable information than monthly testing under varying circumstances. Trends across stable, comparable data points are what drive insight. A single elevated hs-CRP after a week of poor sleep tells you almost nothing useful.
Context loss is one of the biggest failure modes in self-directed analytics. Epigenetic clocks are sensitive to acute stressors, meaning a test taken during a period of illness, intense training, or emotional stress will produce a reading that does not reflect your baseline biological age. Clinical clocks like LinAge2 are often more actionable for intervention tracking than consumer epigenetic products because they are designed for stability under real-world conditions.
The deeper issue is the conflation of lifespan and healthspan. Rigorous statistical analysis is needed to verify whether an intervention actually compresses morbidity or simply extends the tail end of life without improving quality. If your analytics show you are living longer on paper but your functional biomarkers, grip strength, VO2 max, inflammatory load, are not improving, something is wrong with the strategy. We see this reflected in athlete blood testing data too: high-performing athletes who optimize for performance markers often show better healthspan indicators than those optimizing purely for longevity metrics.
The practical takeaway is to pick your Tier 1 panel, test it consistently, and use analytics to track directional change over 12 to 24 months before drawing conclusions. That discipline is more valuable than any single test or platform feature.
Unlock your longevity potential with at-home analytics
Analytics-driven longevity is no longer reserved for research clinics or elite performance centers. The tools are accessible, and the data is actionable at the individual level right now.
Biostarks brings this precision directly to you with at-home biomarker testing powered by advanced Swiss mass spectrometry. You get detailed insights into your vitamins, hormones, amino acids, lipids, minerals, and metabolic markers, analyzed with the same rigor used in clinical research settings. Reports are designed to be clear and actionable, not just a wall of reference ranges. Whether you are building your first longevity baseline or refining an existing protocol, Biostarks at-home biomarker testing gives you the data foundation to make analytics work for your biology, not someone else’s population average.
Frequently asked questions
How often should I test my longevity biomarkers?
For most biohackers, Tier 1 panels every six months and epigenetic clocks annually balance insight with practicality. Testing more frequently adds noise without adding proportional signal unless you are actively tracking a specific intervention.
Are AI-powered platforms more accurate than manual tracking?
Yes. Biological age and mortality risk are predicted more accurately by AI-driven biomarker analytics than by chronological age or manual tracking alone, because machine learning identifies patterns across multiple variables simultaneously.
What interventions are most effective when guided by analytics?
Diet changes, particularly the Mediterranean diet, consistently show strong results. It reduces hs-CRP and improves microbiome diversity while maintaining high long-term adherence when supported by digital platforms.
Does living longer always mean a longer healthy life?
Not necessarily. Caloric restriction and similar interventions may extend lifespan without compressing morbidity, which is why analytics should track healthspan markers like functional capacity and inflammation burden alongside survival metrics.
Can analytics find new longevity targets?
Yes. AI-driven big data analysis recently identified PDAP1 overexpression as a genetic factor linked to shorter lifespan in older adults, a discovery that would have been impossible without large-scale biomarker analytics.


